Note
Go to the end to download the full example code.
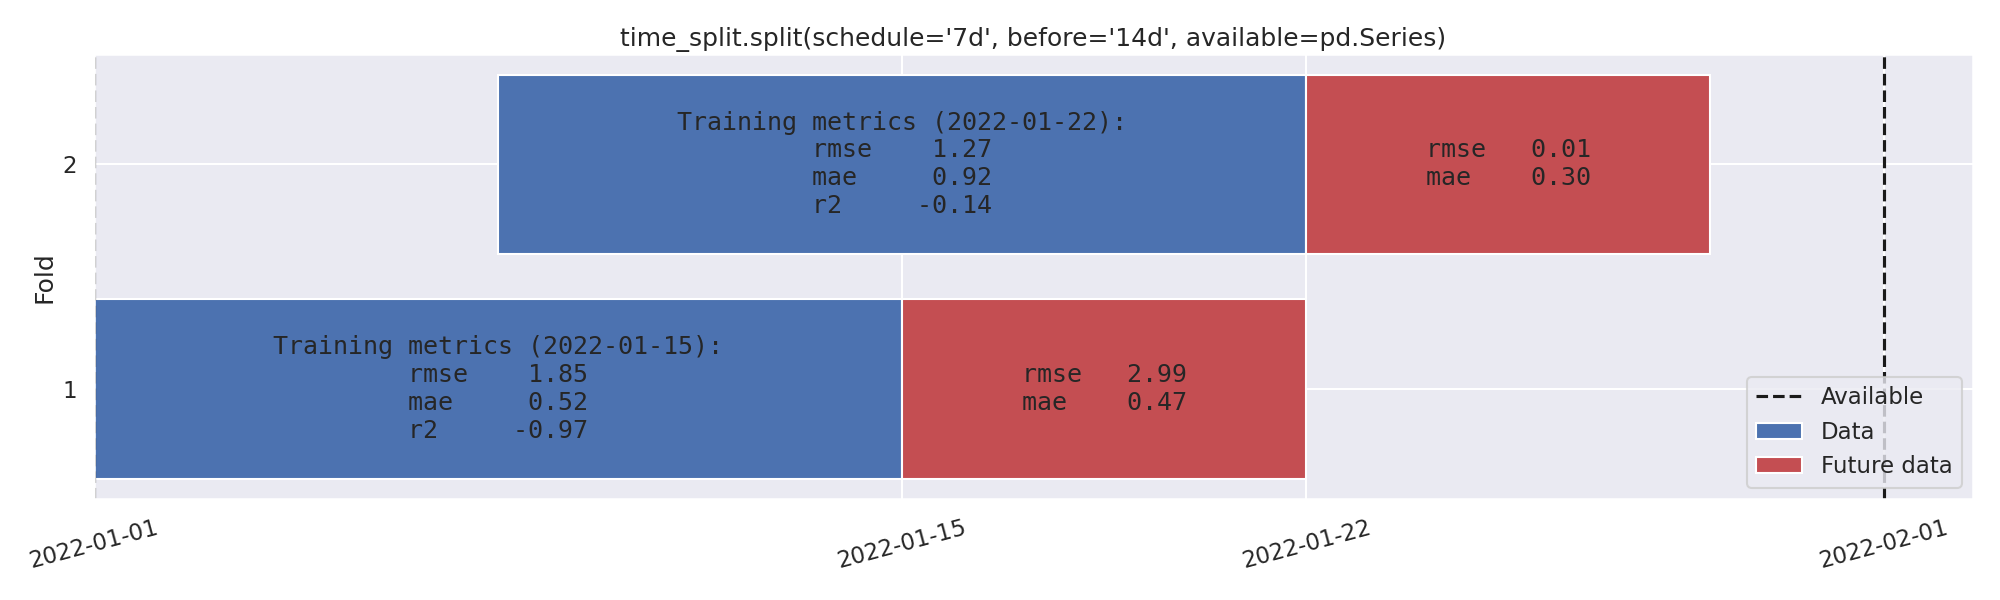
Plotting metrics per fold and data set.#
Using an unbounded timedelta-schedule, with custom bar labels.
import pandas
from numpy.random import default_rng
from rics import configure_stuff
from time_split import log_split_progress, plot, split

configure_stuff(datefmt="")

data = pandas.date_range("2022", "2022-2", freq="38min").to_series()
config = dict(schedule="7d", before="14d", after=1, available=data)
👻 Configured some stuff just the way I like it!
Unbounded (timedelta-string or CRON) schedules require available data to materialize the schedule. When using the
plot-function, this data is also used to create bar labels unless they’re explicitly given. We would like to
plot metrics instead of just dataset sizes. Let’s create some dummy metrics.
metrics = {}
random = default_rng(2019_05_11).random
Adding a get_metrics callback to time_split.log_split_progress() will add formatted metric output to the
fold-end message emitted at the end of each iteration.
for fold in log_split_progress(
    split(**config),
    get_metrics=lambda k: metrics[k.date()],
):
    metrics[fold.mid.date()] = {
        "before": {"rmse": 2 * random(), "mae": random(), "r2": -random()},
        "after": {"rmse": 3 * random(), "mae": 1.5 * random()},
    }
[time_split:INFO] Begin fold 1/2: '2022-01-01' <= [schedule: '2022-01-15' (Saturday)] < '2022-01-22'.
[time_split:INFO] Finished fold 1/2: [schedule: '2022-01-15' (Saturday)] after 29 μs. Fold metrics:
        rmse   mae     r2
before  1.85 0.518 -0.974
after  2.991 0.466    NaN
[time_split:INFO] Begin fold 2/2: '2022-01-08' <= [schedule: '2022-01-22' (Saturday)] < '2022-01-29'.
[time_split:INFO] Finished fold 2/2: [schedule: '2022-01-22' (Saturday)] after 13 μs. Fold metrics:
        rmse   mae     r2
before 1.266 0.921 -0.135
after  0.009 0.301    NaN
The bar_labels-arguments expects a list of tuples on the form [("left-label", "right-label")], plotting string
tuples in the same order in which they were originally returned by the split()-method.
bar_labels = [
    (
        (
            f"Training metrics ({date}):\n"  # Header
            + pandas.Series(fold_metrics["before"]).to_string(float_format="%.2f")
        ),
        pandas.Series(fold_metrics["after"]).to_string(float_format="%.2f"),
    )
    for date, fold_metrics in metrics.items()
]
ax = plot(**config, bar_labels=bar_labels)
ax.figure.set_size_inches(20, 6)
Bar height is not based on bar_labels, so make sure to configure e.g. rcParams["figure.figsize"] beforehand when
the bar_labels text is large. Alternatively, you may pass a pre-initialized matplotlib.axes.Axes-instance
using the ax keyword-argument.
Total running time of the script: (0 minutes 0.167 seconds)